What you'll learn
- Separate loading performance from runtime performance
- Focus paths for slow LCP, janky runtime, measurement and ship checklists
- Match hangups to bundle, re-renders, waterfalls, JS cost or layout shift
- Measure with Web Vitals and the React Profiler before optimizing
Performance in React apps falls into two buckets:
- Loading performance - how fast code and assets arrive (mostly delivery)
- Runtime performance - how smoothly the app responds after load (mostly React and JS on the main thread)
This page is the performance cluster hub. Use the focus picker when you know the symptom. Use the hangup matcher when you need the deepest sibling article. Then measure, change one thing, and re-measure.
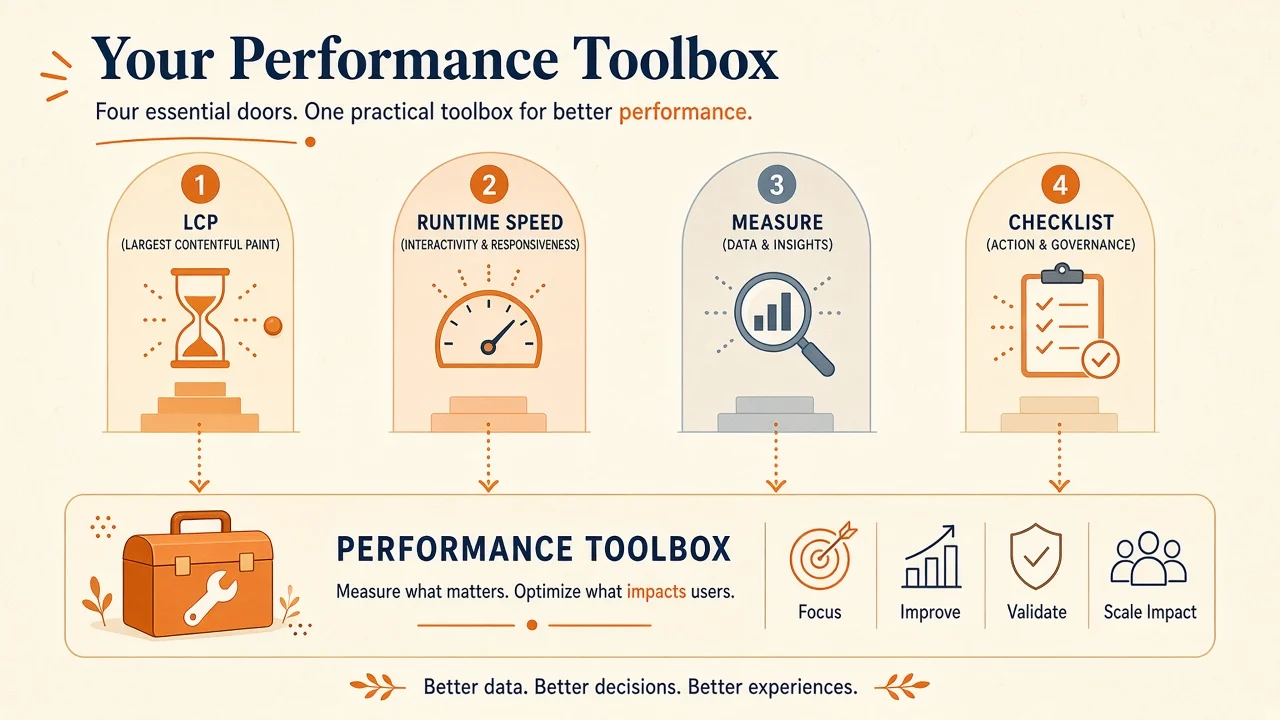
How to use this hub
- Name the bucket. Is the user waiting on first paint, or on a click after the page is open?
- Pick one metric. LCP for load. INP for interaction. Profiler self-time for component work. CLS when the page jumps.
- Open one deeper article. Bundle, re-renders, waterfalls or JS patterns. Do not do all four at once.
- Re-measure. If the number did not move, revert and try the next hangup.
Pick a performance focus
Try it: performance focus
Pick what hurts. You get an ordered focus, why it fits, and a first-week plan.
Focus
Your focus
Treat load as a delivery problem first
Slow Largest Contentful Paint is usually bytes, images and critical path, not memo. Shrink what you ship, then improve how you render HTML.
- Web Vitals
Know which vital you are chasing.
- PageSpeed Insights
Field and lab signals for the URL.
- Bundle Size Optimization
Code splitting and unused JS.
- React Rendering Strategies
SSR and streaming when HTML arrives late.
First week
Run Lighthouse or PageSpeed on the slow URL. Cut one heavy route chunk and one oversized image. Re-check LCP.
Tip: write down one metric before you open a deep dive. LCP for load, INP for clicks, Profiler self-time for component work.
Checkpoint
LCP is slow and the route ships a large unused library. What first?
Pick an answer, or press A, B, C on your keyboard.
Match a performance hangup
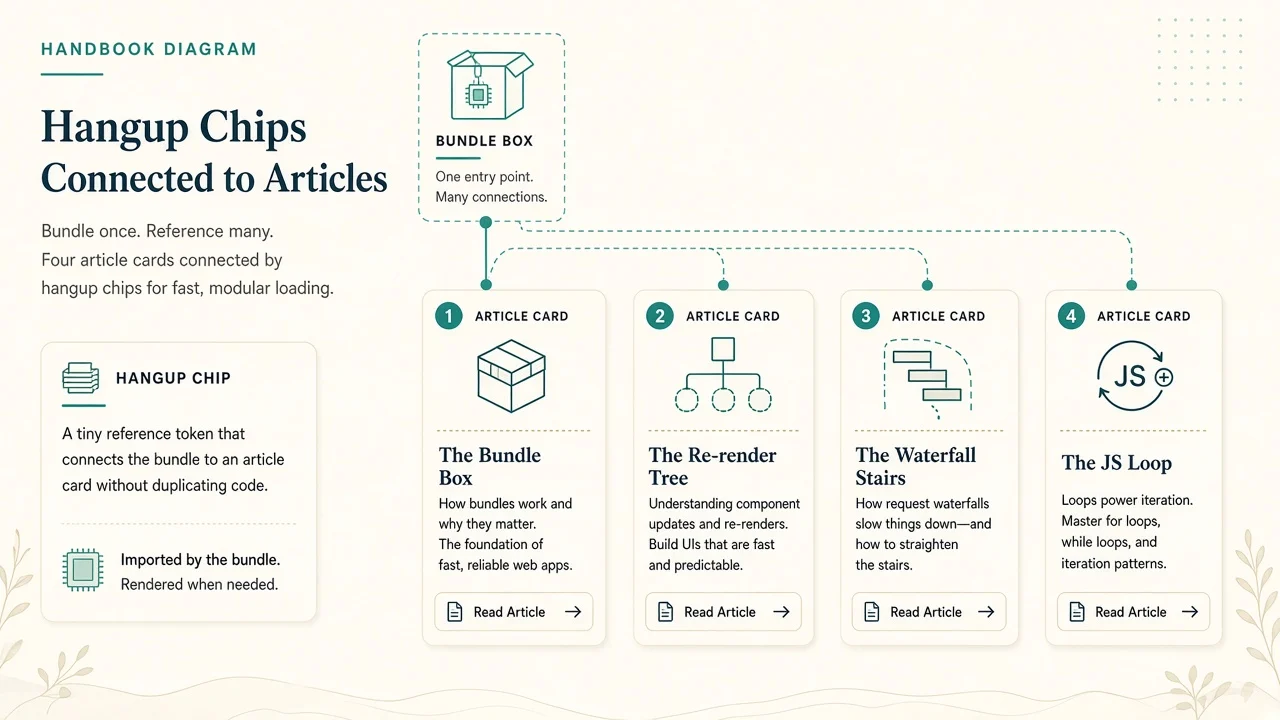
Try it: match a performance hangup
Choose the hangup you see. The matcher points to the deepest article for that job.
Hangup
The hangup
LCP or TTI is slow and Coverage or the bundle analyzer shows a heavy route chunk.
Start here
Bundle Size OptimizationLoad problems are usually bytes and critical path. Split routes and drop unused libraries before memoizing components.
Also consider
Hidden Side of Frontend DeploymentsLazy chunks must still resolve for open tabs after deploy.
Related: Lazy chunks after deploy
Tip: Related points at a sibling topic, not the same article as Start here. Open one deep dive, then come back.
Key takeaway
Name the bucket (load vs runtime) before picking a library or a memo.
Loading vs runtime
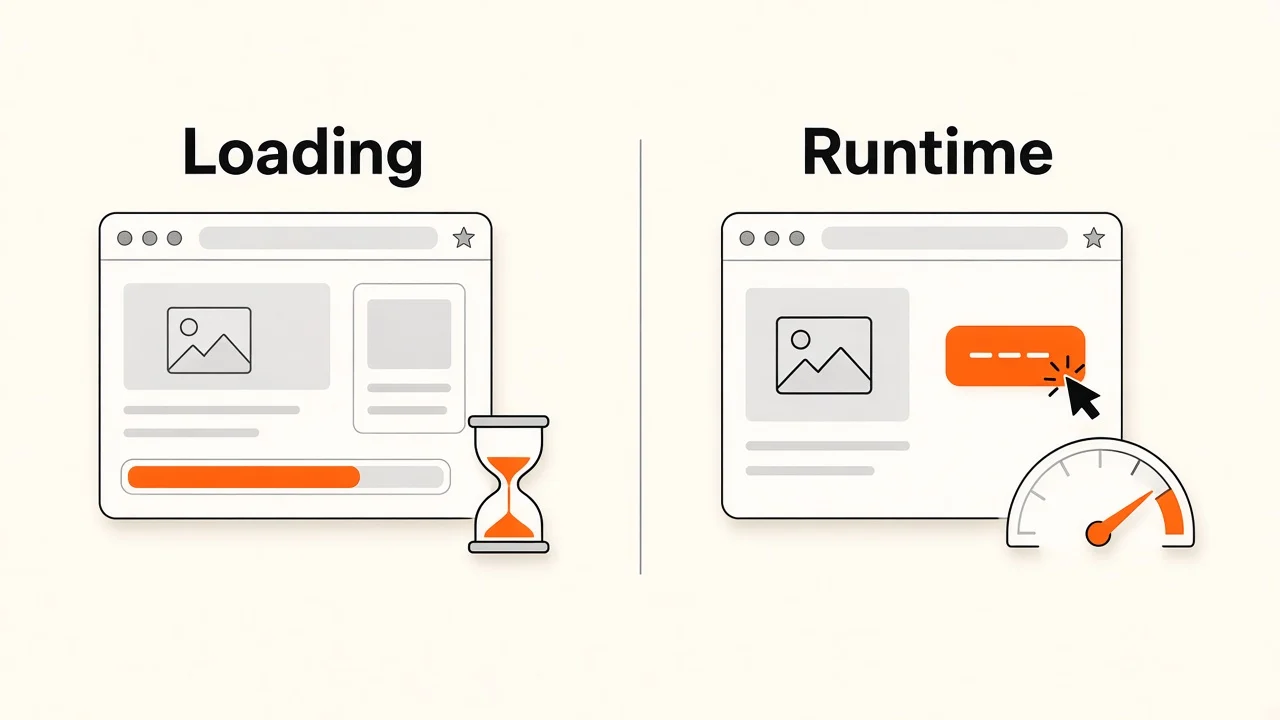
Loading performance measures how fast content becomes usable. Core Web Vitals for this lane include Largest Contentful Paint (LCP) and Cumulative Layout Shift (CLS). Older guides mentioned First Input Delay (FID); for interaction responsiveness, use Interaction to Next Paint (INP) instead.
Runtime performance measures how smooth the app feels after load: frame rate, long tasks, memory and how often React commits large trees for small updates.
The key habit
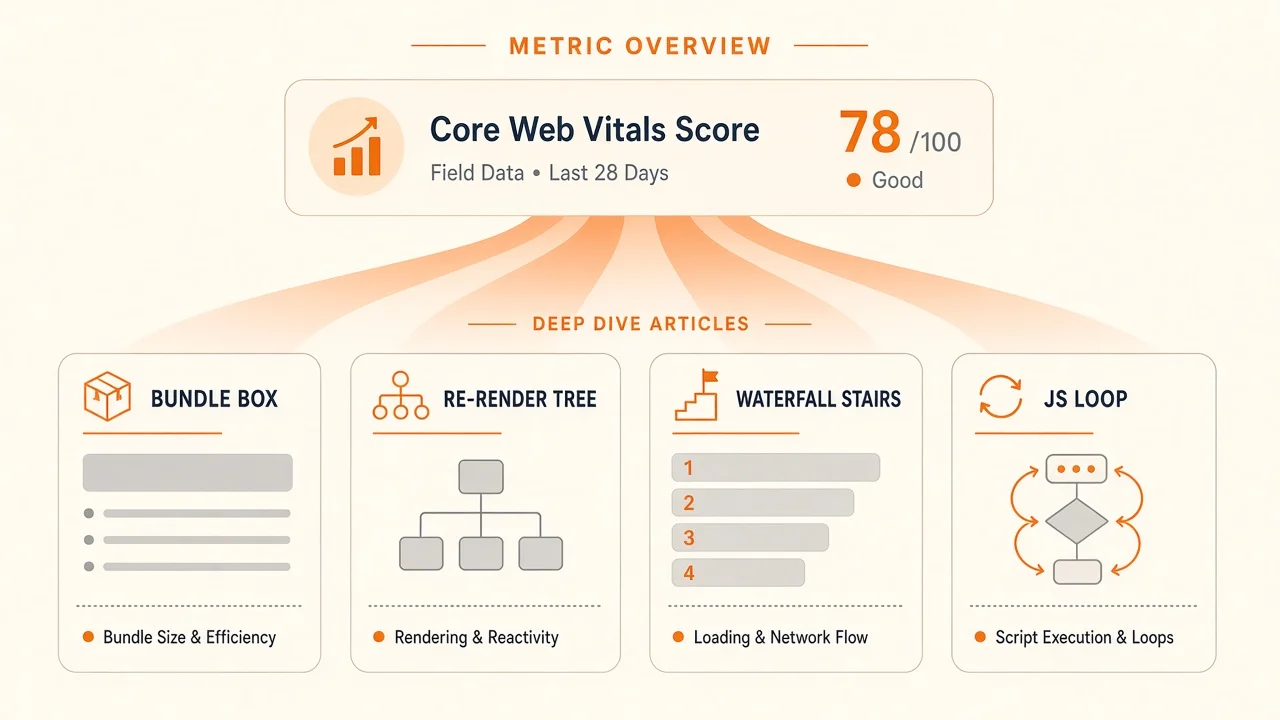
Name the bucket and one metric before you open a deep dive. LCP for load, INP for clicks, Profiler self-time for component work.
Load lane: measure and optimize
Which tool for which signal
| Tool | Best for | Insight |
|---|---|---|
| PageSpeed Insights (opens in a new tab) | Field plus lab signal on a public URL | Start here when you need a shared number for LCP, INP or CLS |
| Lighthouse (opens in a new tab) | Repeatable lab baseline in CI or locally | Good for regressions on a changed route; weaker as a substitute for real-user data |
| WebPageTest (opens in a new tab) | Waterfall detail and filmstrip | Use when you need to see which request blocked first paint |
| Web Vitals (opens in a new tab) / INP (opens in a new tab) | Definitions and thresholds | Read these when the team argues about which metric counts |
Insight: lab scores without a production-like device and network lie. Pair Lighthouse with at least one field view when stakeholders ask "is it slow for users?"
Insight: if Network is a staircase of independent requests, leave the memo debate and open Eliminating Async Waterfalls.
Optimizing load
Send as little code and media as possible, then improve how HTML arrives.
-
Compress responses (gzip or Brotli) and optimize images and video
Insight: LCP is often a hero image or font, not a missinguseMemo. -
Lazy-load below-the-fold media
Insight: reserve space (width/height or aspect-ratio) or CLS climbs while LCP looks fine. -
Build and minify assets; split routes so unused screens stay out of the first load
Insight: route splits beat wrapping the home page in memo. See Bundle Size Optimization. -
Use
React.lazyandSuspensecarefully
Insight: lazy chunks must stay available after deploy for open tabs (The Hidden Side of Frontend Deployments). -
SSR and streaming can improve first paint when the HTML path is the bottleneck
Insight: if the browser waits on JS before any meaningful HTML, open React Rendering Strategies.
Runtime lane: measure and optimize

Modern React is fast by default. Do not optimize until a component or interaction is slow in a production-like scenario.
- Do not optimize too soon
- Know what to measure
Decision tree
When the Profiler or Chrome Performance panel shows pain after load, pick the branch:
- Slow render (high self-time inside one component) → JavaScript Performance Patterns. Offload true background work to Web Workers when it should not block paint.
- Too many re-renders (wide commit trees for a small state change) → Stop Unnecessary Re-renders.
- Slow data (Network stair-steps or mount-time fetch chains) → Eliminating Async Waterfalls.
Read more from Alex Sidorenko in his series A Visual Guide to React Rendering (opens in a new tab).
Helpful measurement links:
- Measuring Performance in Chrome (opens in a new tab)
- DevTools Coverage (opens in a new tab)
- React Profiler (opens in a new tab)
- How to Detect Slow Renders in React? (opens in a new tab)
- How many re-renders are too many? (opens in a new tab)
Memoization and list virtualization help different problems:
- memo (opens in a new tab), useMemo (opens in a new tab), useCallback (opens in a new tab) after you measure
Insight: memo after the flame chart, not before shipping the feature. - Virtualization (opens in a new tab) for huge lists (react-window (opens in a new tab))
Insight: virtualization cuts DOM work; it does not fix a 2MB route chunk.
Checkpoint
Which metric should you use today for interaction responsiveness?
Pick an answer, or press A, B, C on your keyboard.
UX performance practices
- Throttle or debounce high-frequency DOM updates; humans cannot usefully process hundreds of visual updates per second
- Read how fast of an interaction is too fast (opens in a new tab)
- For loading states under about 400ms, either skip the spinner or keep it visible long enough that it does not flicker
-
Performance anti-patterns
These mistakes do not need another hangup chip. Avoid them on purpose:
- Memo as an LCP fix.
React.memodoes not shrink the network. Cut bytes and media first. - Clinging to FID docs. Teach INP for interaction responsiveness; keep FID only as a quiz distractor or history note.
- Spinner flicker under 400ms. A flash of pending UI feels slower than no spinner at all.
- Experimental VDOM as default. Treat niche renderers as research. Measure against your own product before adopting them as architecture.
Performance checklist
- I know whether the pain is load or runtime
- I tracked LCP, INP or CLS (not FID) for the critical flow
- Bundle size is reviewed for changed routes
- Re-renders and JS cost were profiled before memo sprawl
- Async waterfalls were checked in Network
- A change was re-measured or reverted
Further reading
- Bundle Size Optimization
- Stop Unnecessary Re-renders
- Eliminating Async Waterfalls
- JavaScript Performance Patterns
- React Rendering Strategies
- Improving React Interaction Times by 4x (opens in a new tab)
- One Simple Trick to Optimize React Re-Renders (opens in a new tab)
- React Performance Checklist - Cory House (opens in a new tab)
Conclusion
Performance work is triage, not a library shopping trip. Separate load from runtime, pick one metric, open one deep dive, and prove the number moved. If it did not move, undo the complexity and try the next hangup.
The hub stays useful when teams return with a new symptom: re-run the focus picker, open one sibling article, and leave the rest alone until the first metric improves.
The key takeaway
Measure the bucket that hurts, then fix that bucket. Memo is not a load-time strategy.
Check your understanding
LCP is slow and a route ships a large unused library. What first?
Pick an answer, or press A, B, C on your keyboard.
Decision framework
| Symptom | First move |
|---|---|
| Slow LCP | Bundle and media (Bundle Size) |
| Slow click / INP | Profiler, then re-renders or JS cost |
| Stair-step network | Async waterfalls |
| Layout jump | CLS: reserve space, avoid late inserts |
| Post-deploy ChunkLoadError | Deployments |
When not to optimize
- You have no metric and no user complaint
- You are about to memoize “everywhere” without a profile
Checklist
- Named the bucket: load vs runtime
- Picked one metric
- Changed one thing and re-measured
Recap
What to remember from this article
Sections read
0
Questions
0
none answered yet
Quiz
0
not taken yet
Up next: Why Parent State Re-renders Children · 8 min
Continue